All posts
-
🔗Colorado Avalanches By The Numbers in R
A look at avalanches in Colorado. Please not I'm not an avalanche expert, so please take these interpretations with a healthy dose of skepticism.
-
🔗Data Science Resources
A collection of resources on data science and machine learning primarily in R.
-
🔗Classifying High Resolution Aerial Imagery - Part 1
The following note documents a proof of concept for classifying vegetation with 4 band 0.1m aerial imagery. We used sagebrush, bare ground, grass, and PJ for classes. approximately 300 training polygons were used as a training data.
-
🔗Making a Chloropleth Map in R
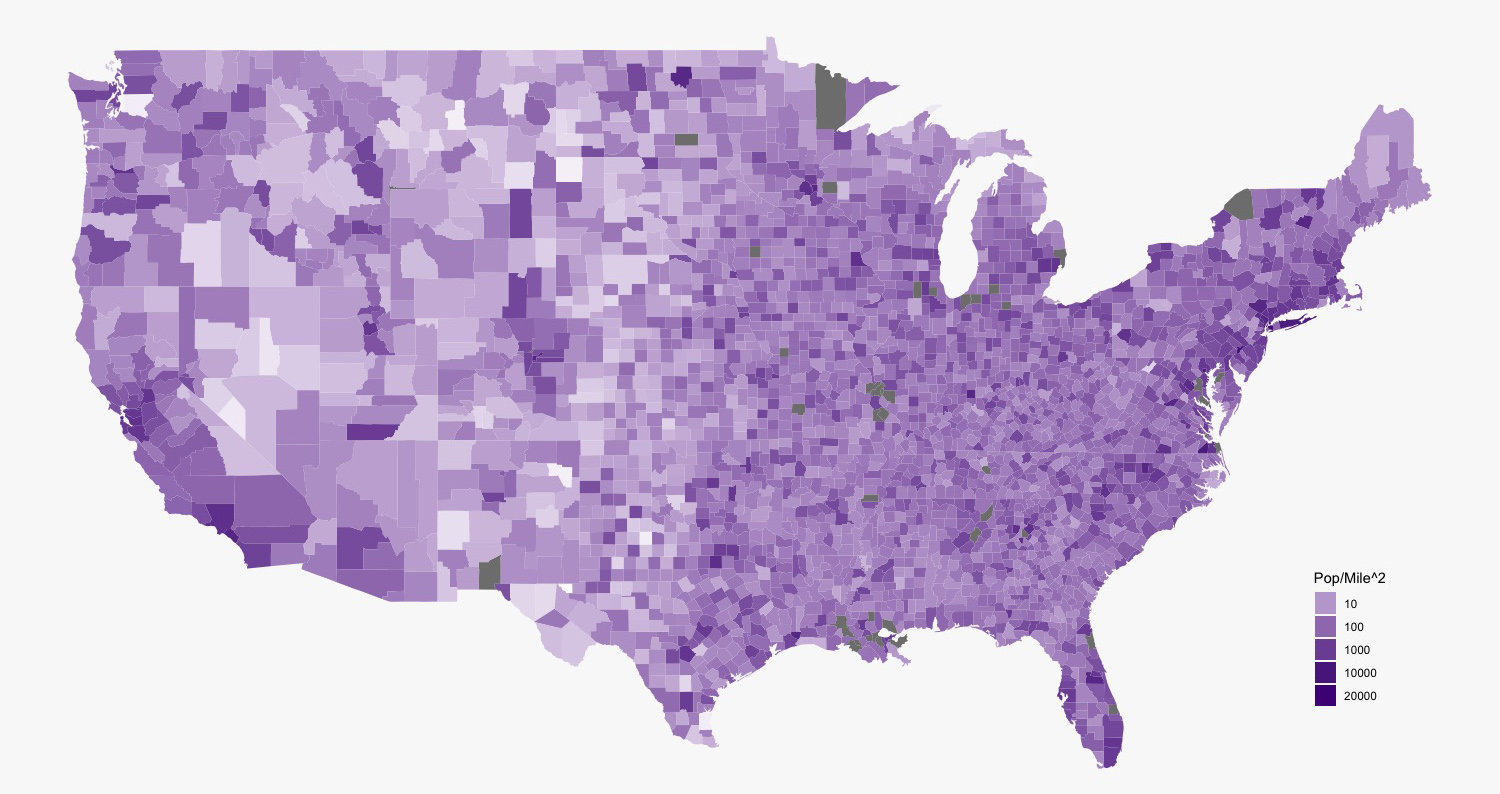
Load the libraries.
-
🔗D3:Basic Line Chart
This is a basic line chart built with D3. I've written a few more tutorials on how to make charts starting out very basic and moving to a little more complex. I'm no expert, so these are how a beginner (at both javascript and D3) would explain everything. Some might find that methodology helpful. My previous tutorials: My first charts, SVG Plots, Scatterplot.
-
🔗D3.js: Basic ScatterPlot
I've made a few bar charts up to this point. But really what I want to do is plot data over time. We need to figure out how to add x and y axis and work with x and y coordinates. The next logical step then, is to make a scatterplot.