All posts
-
🔗D3js River flows
I'm working on a website for a rafting non-profit. I thought it would be cool if they could display the flow data for local rivers. I also thought this would be good time for me to learn more about D3js and the USGS instantaneous flow data API.
-
🔗Django Relationships
For some reason, in the winter I get the urge to learn something new. This year, I'm attempting to pick up Django again (gave an effort a year ago too). One of the things I wanted to better understand is how to implement database relationships.
-
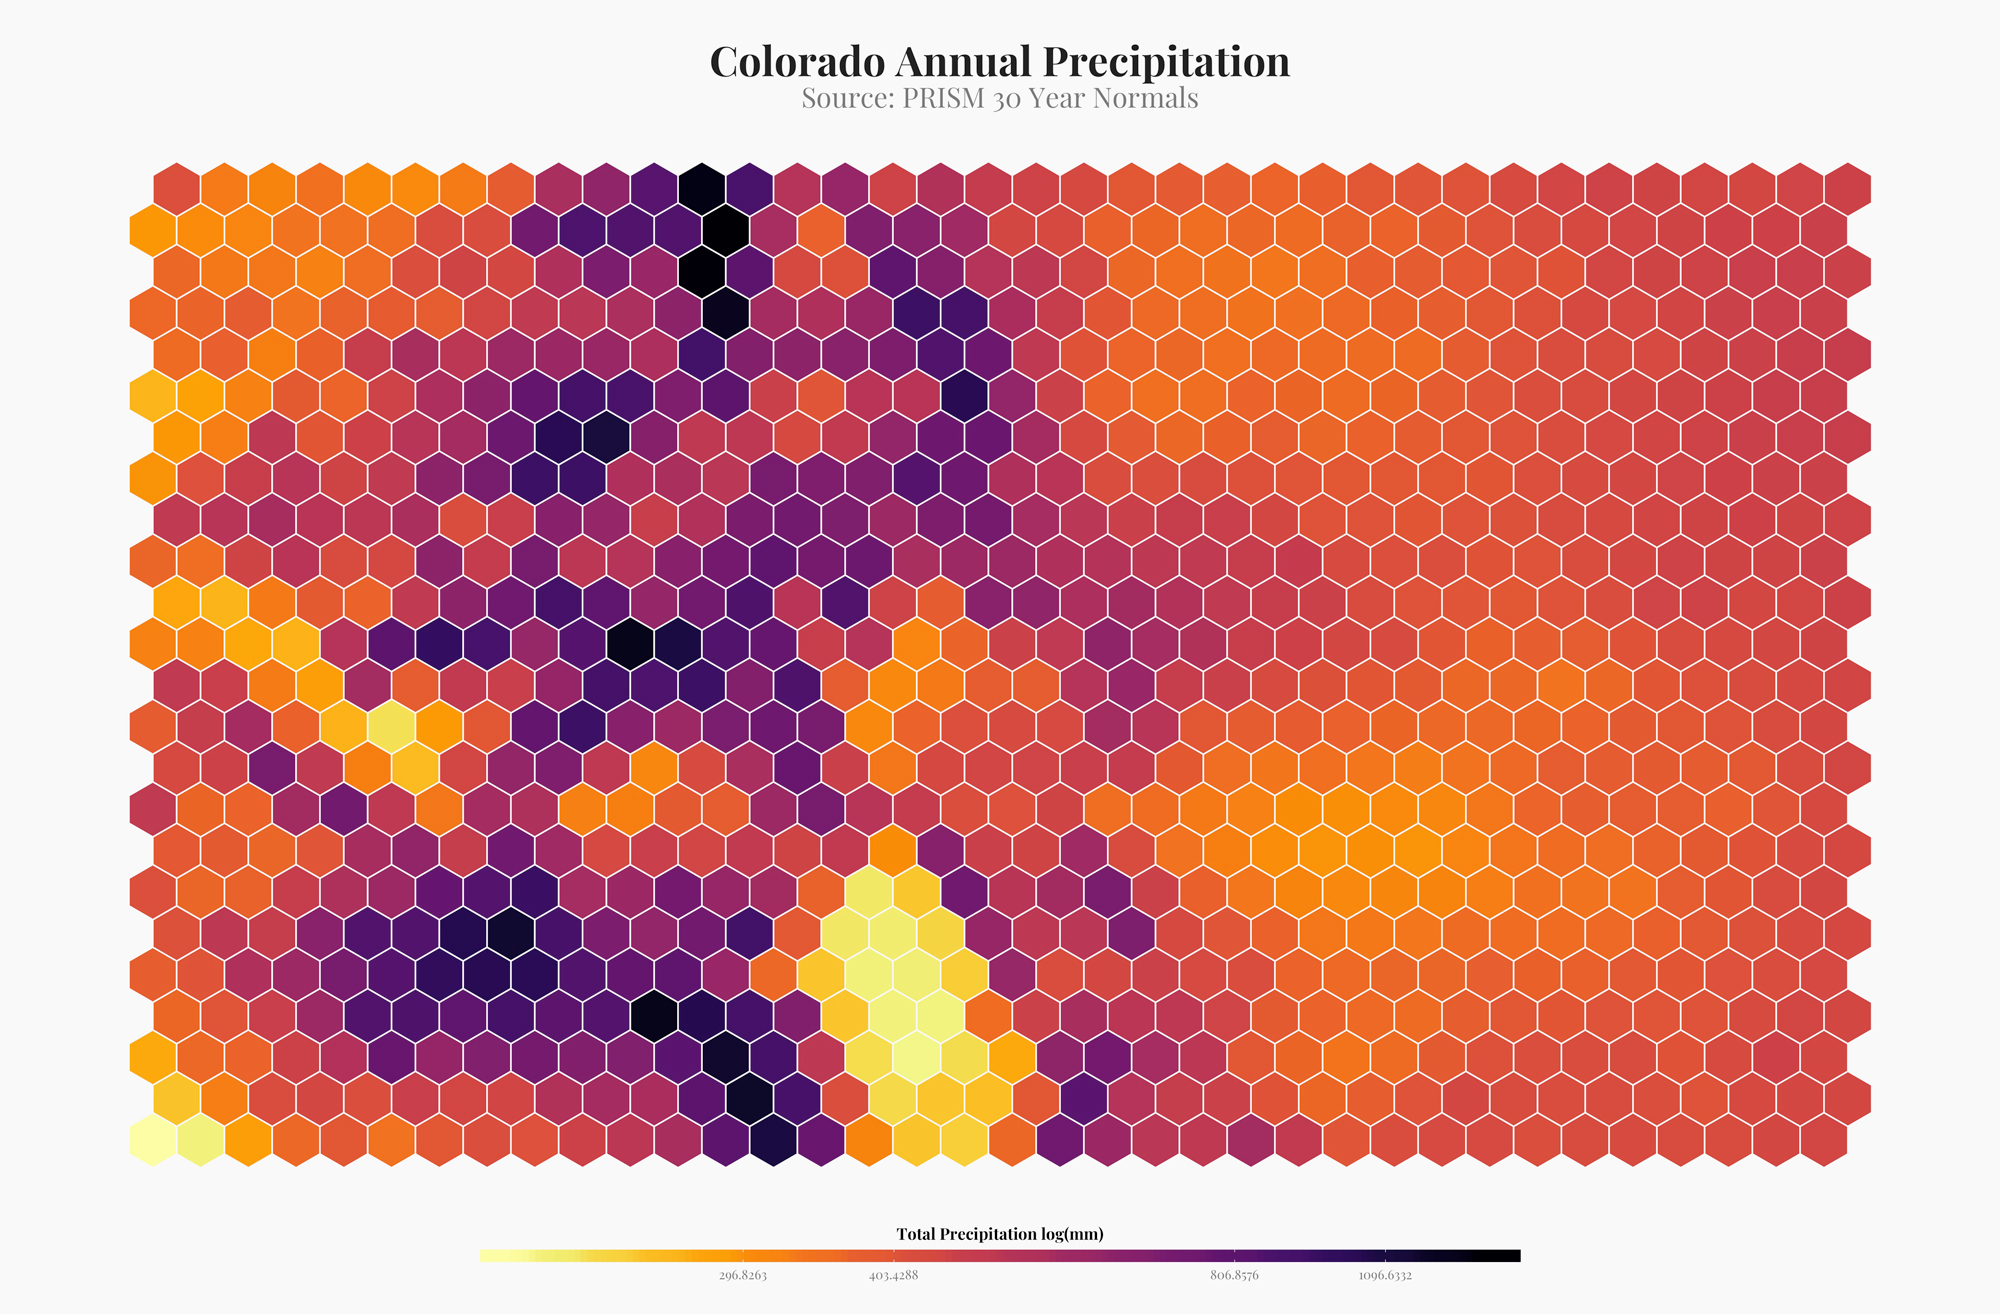
🔗Colorado: Hex Plots, APIs, and D3js
After my last blogpost I was a little frustrated at how poorly the title text resized using ggplot and ggsave. It was a minor issue to be honest, but I figured I could learn something new by exporting the data as geojson and plotting it using D3 js. So here it goes.
-
🔗Colorado: Hex Plots, API packages, and R
I've been seeing a lot of hex plots made with r. They are a way to semi-artistically visualize spatial data. Although I don't think this is completely appropriate for most visualizations, it looks amazing. Here are a few examples of how I made hex plots in R.
-
🔗Spatially Balanced Sample Designs in R with `spsurvey::grts()`
We've been using spatially balanced stratified study designs more frequently at work these days. They are a good way to make probabilistic inference over large areas. A popular method of creating these designs is using the R function
spsurvey::grts(). The following is a basic (very basic) explainer of how to get up and running withgrts()function and what it is. But a bit about GRTS and spatially balanced study design before we get coding. -
🔗Statistics in R: Resources for Understanding Statistics in R
This is a collections of resources that have helped me learn and understand statistics in R.