All posts
-
🔗Gunnison sage-grouse Habitat Comparison
Similar to my post last week, we are again looking at another AIM data visualization. The last visualization was created from the raw AIM data, pulled from ArcGIS online. This visualization is pulled from terradat, AIMs online data repository for QA/QCed data, and looks at cover over three populations of Gunnison sage-grouse in Colorado, the San Miguel population, the Gunnison population and the Pinon Mesa population.
-
🔗Some AIM Data Visualizations from Work
I don't put a lot of what I do at work here. I try to keep work at work and a lot of what I post here is for fun. Lately though, I've been producing some visualizations from Assessment Inventory and Monitoring (AIM) data that I think are worth sharing.
-
🔗VS Code: Add a Rmarkdown Code Chunk Snippet Key Binding
I recently started using VS code for R development. There is an awesome newish R extension for VS Code. It takes a little setup, it works best with the addition of radian, a python package, but otherwise it works really well. There are solid instructions on the extension page. I love Rstudio for the most part, but I got frusterated by the lack of editor customization (mostly line height). So here we are.
-
🔗#30daymapchallange Day Green
For the seventh day of the #30daymapchallange, I made a map using Open Street Map Data to map my old neighborhood. I feel lucky to have grown up near mountains in a city.
-
🔗#30daymapchallange Day 1 Points
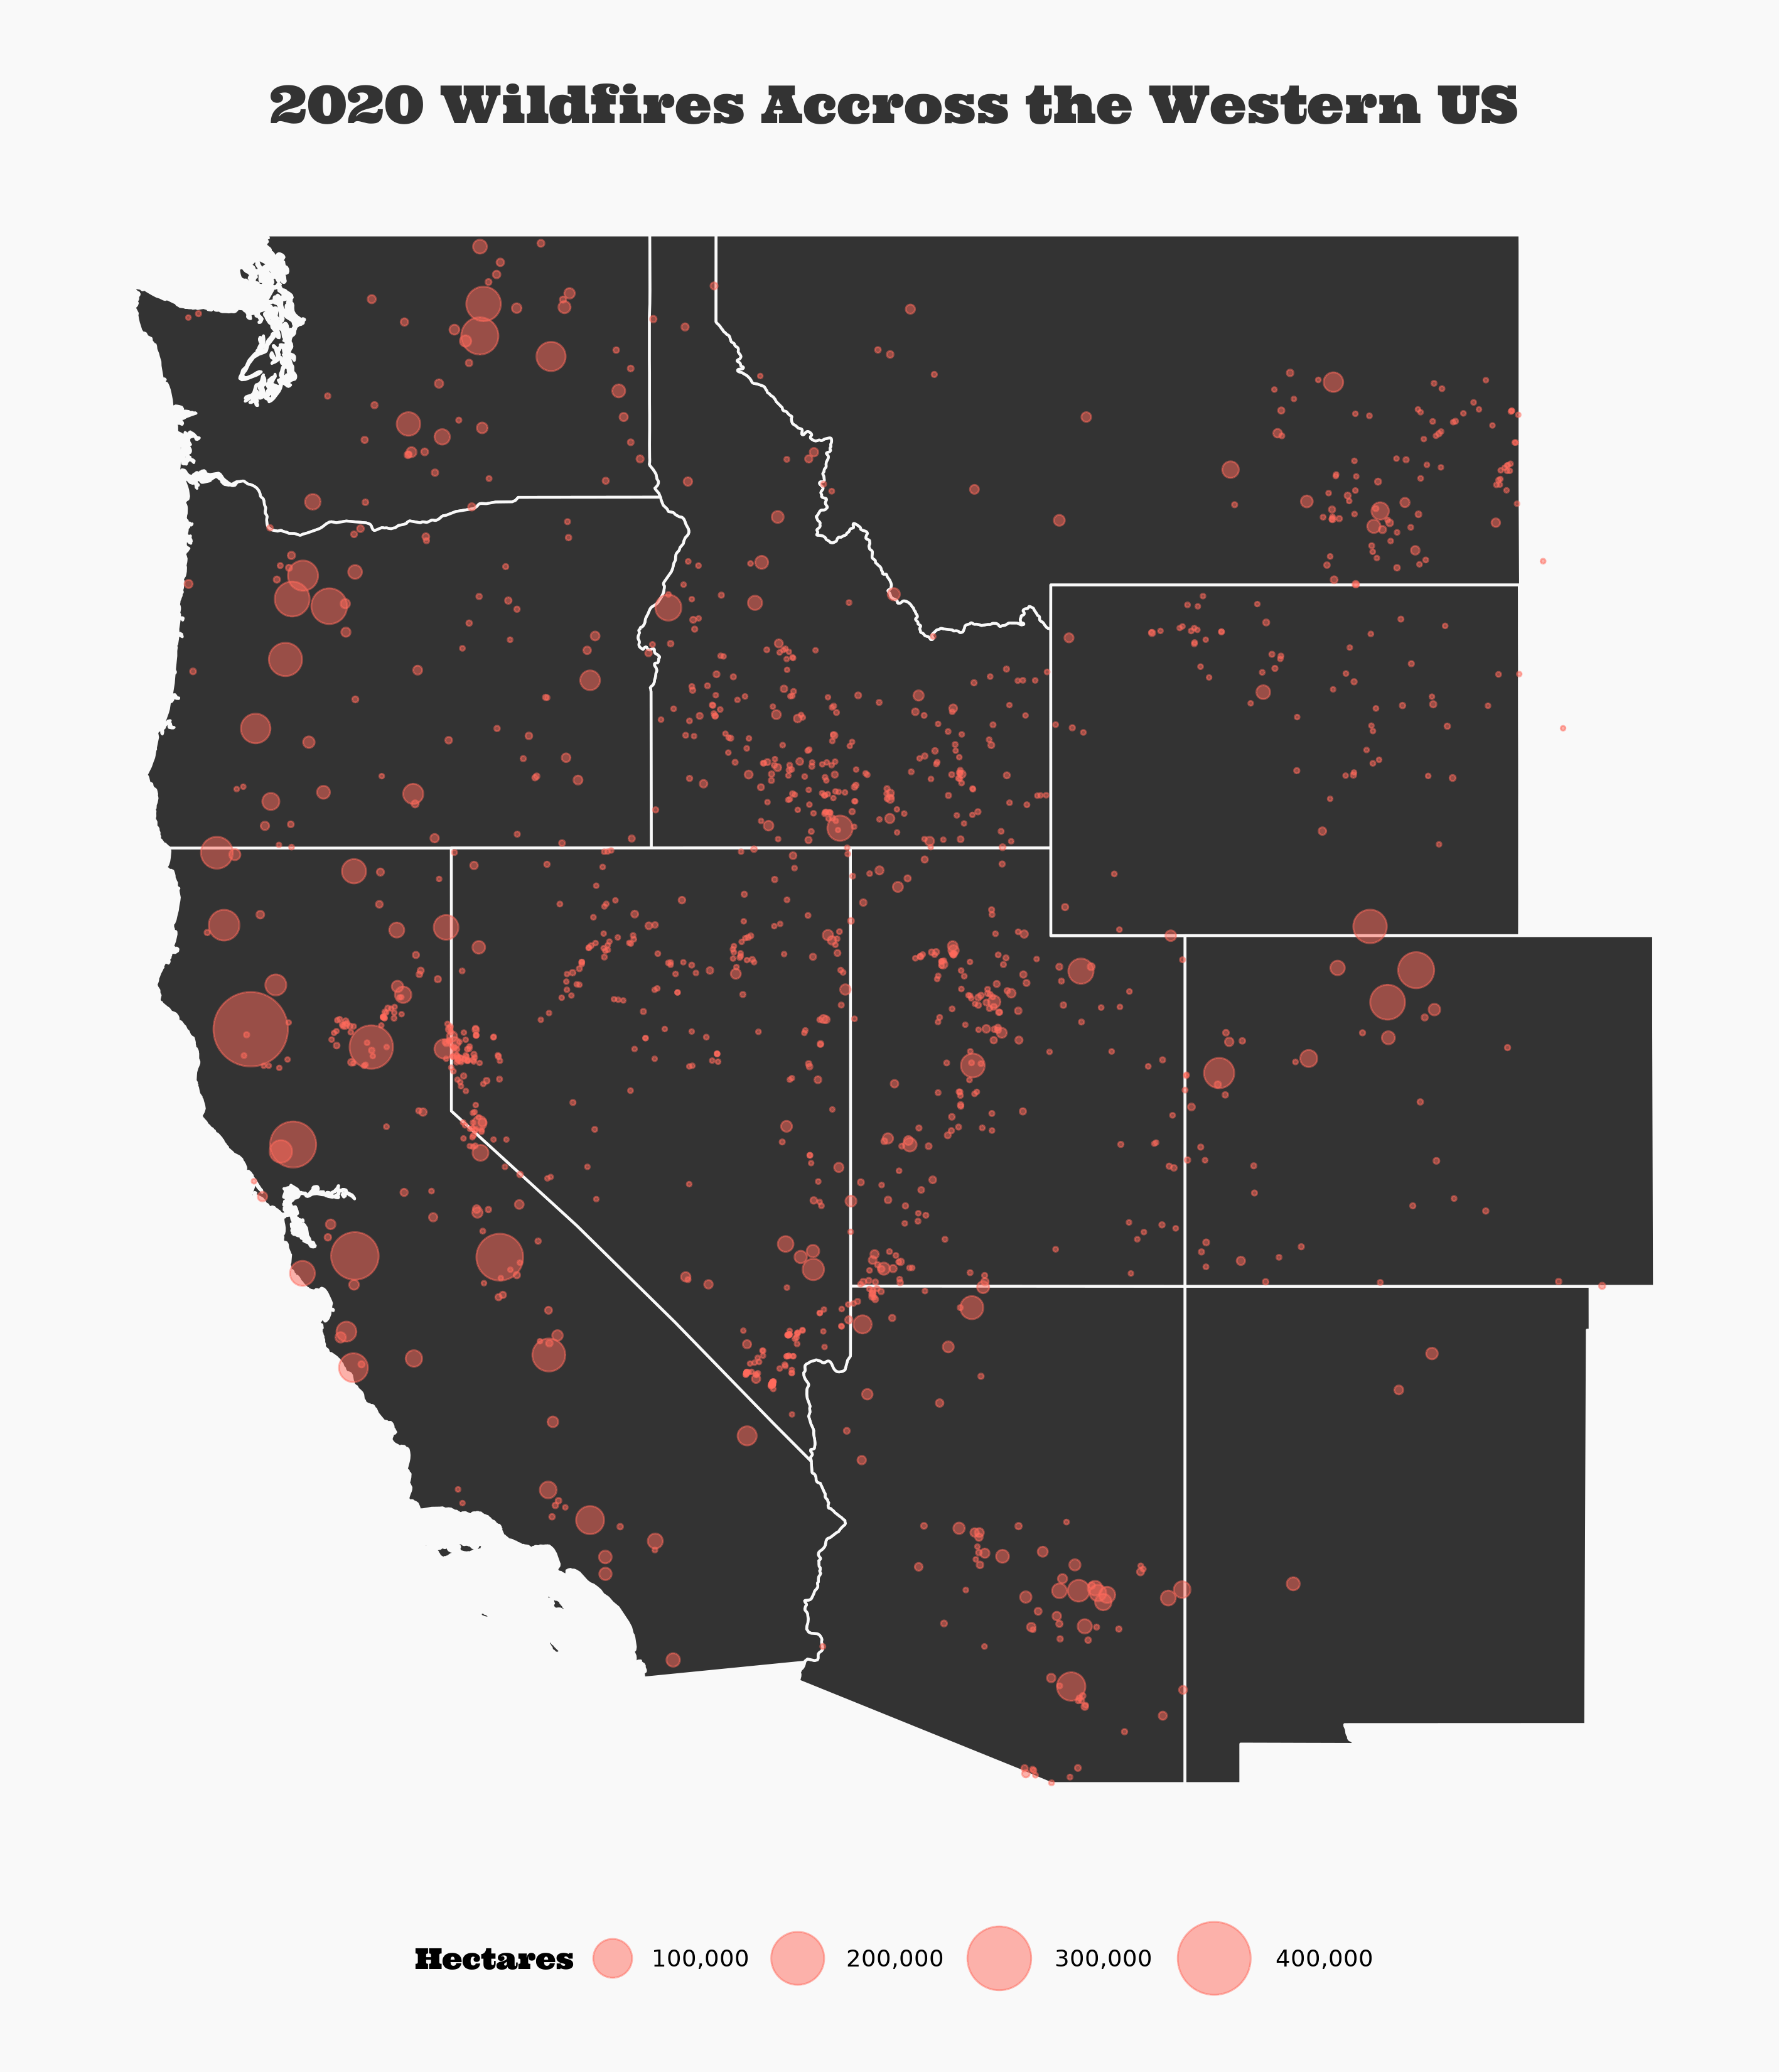
I'm starting the #30daymapchallange Points prompt by continuing my obsession with the current fire season. Here are all the fires from 2020 mapped as points. What a year.
-
🔗Wildfires in the West
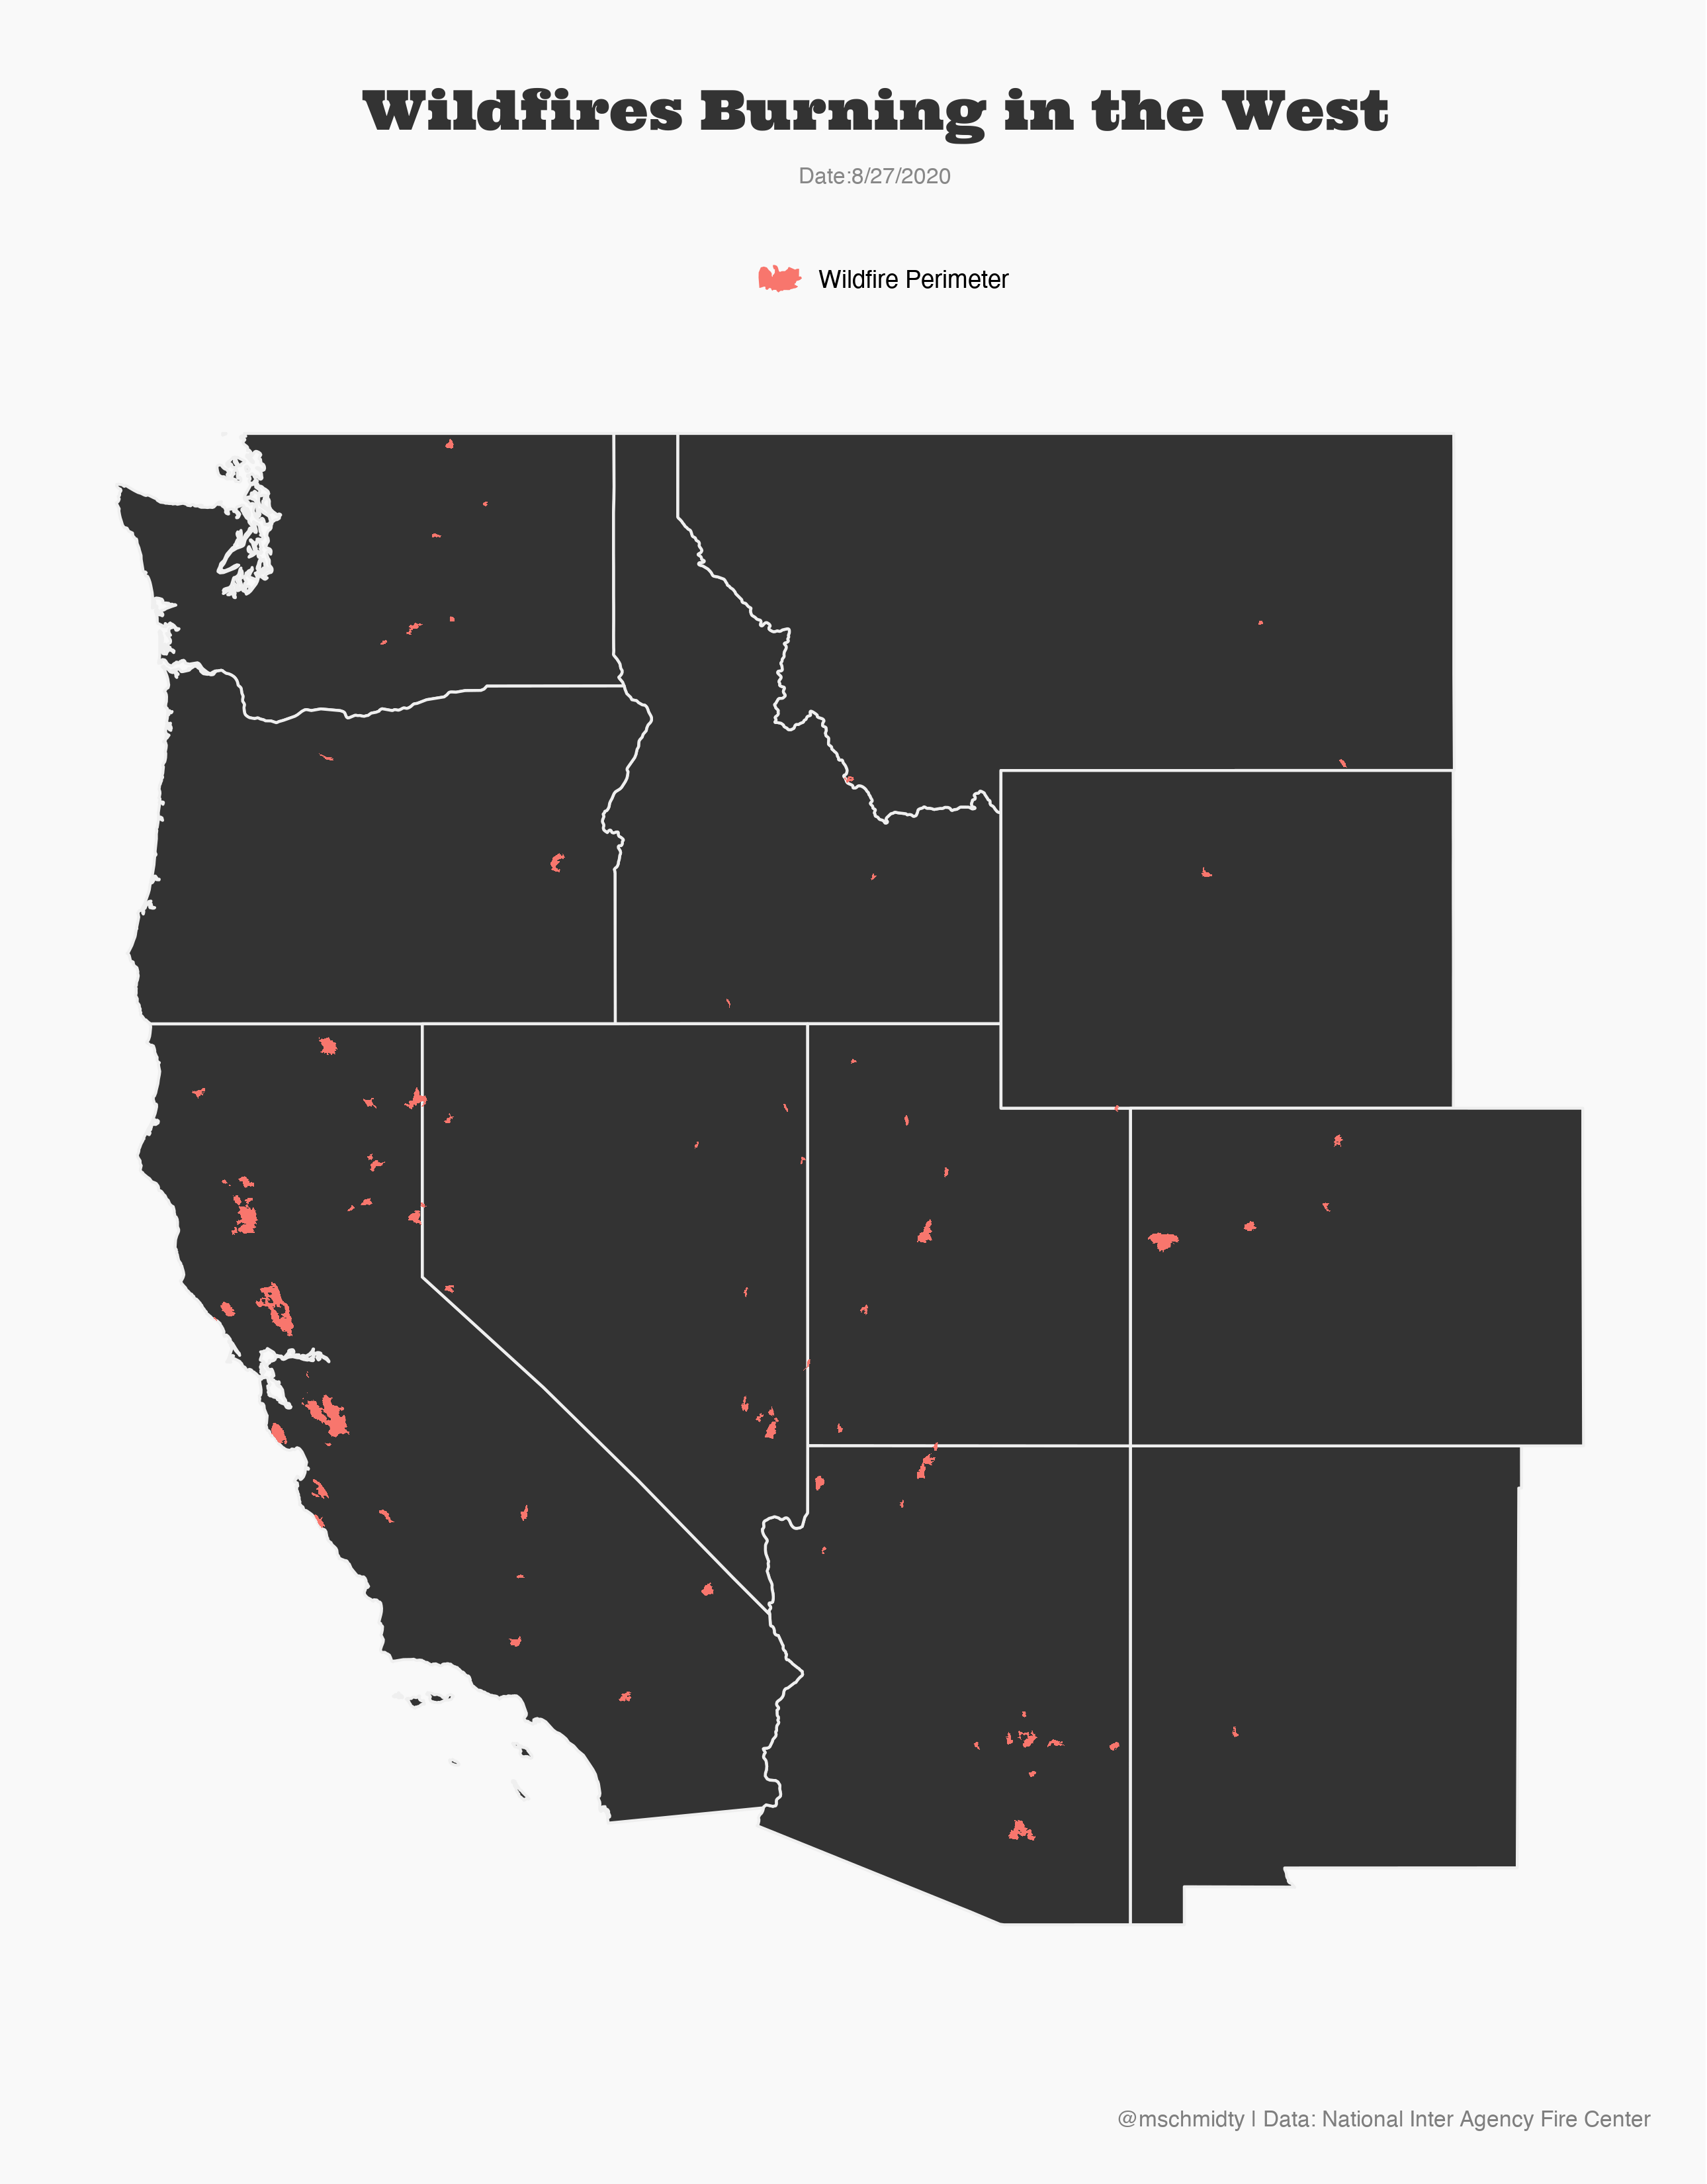
The second largest fire in Colorado's History is currently burning. California is also having a historic fire season.