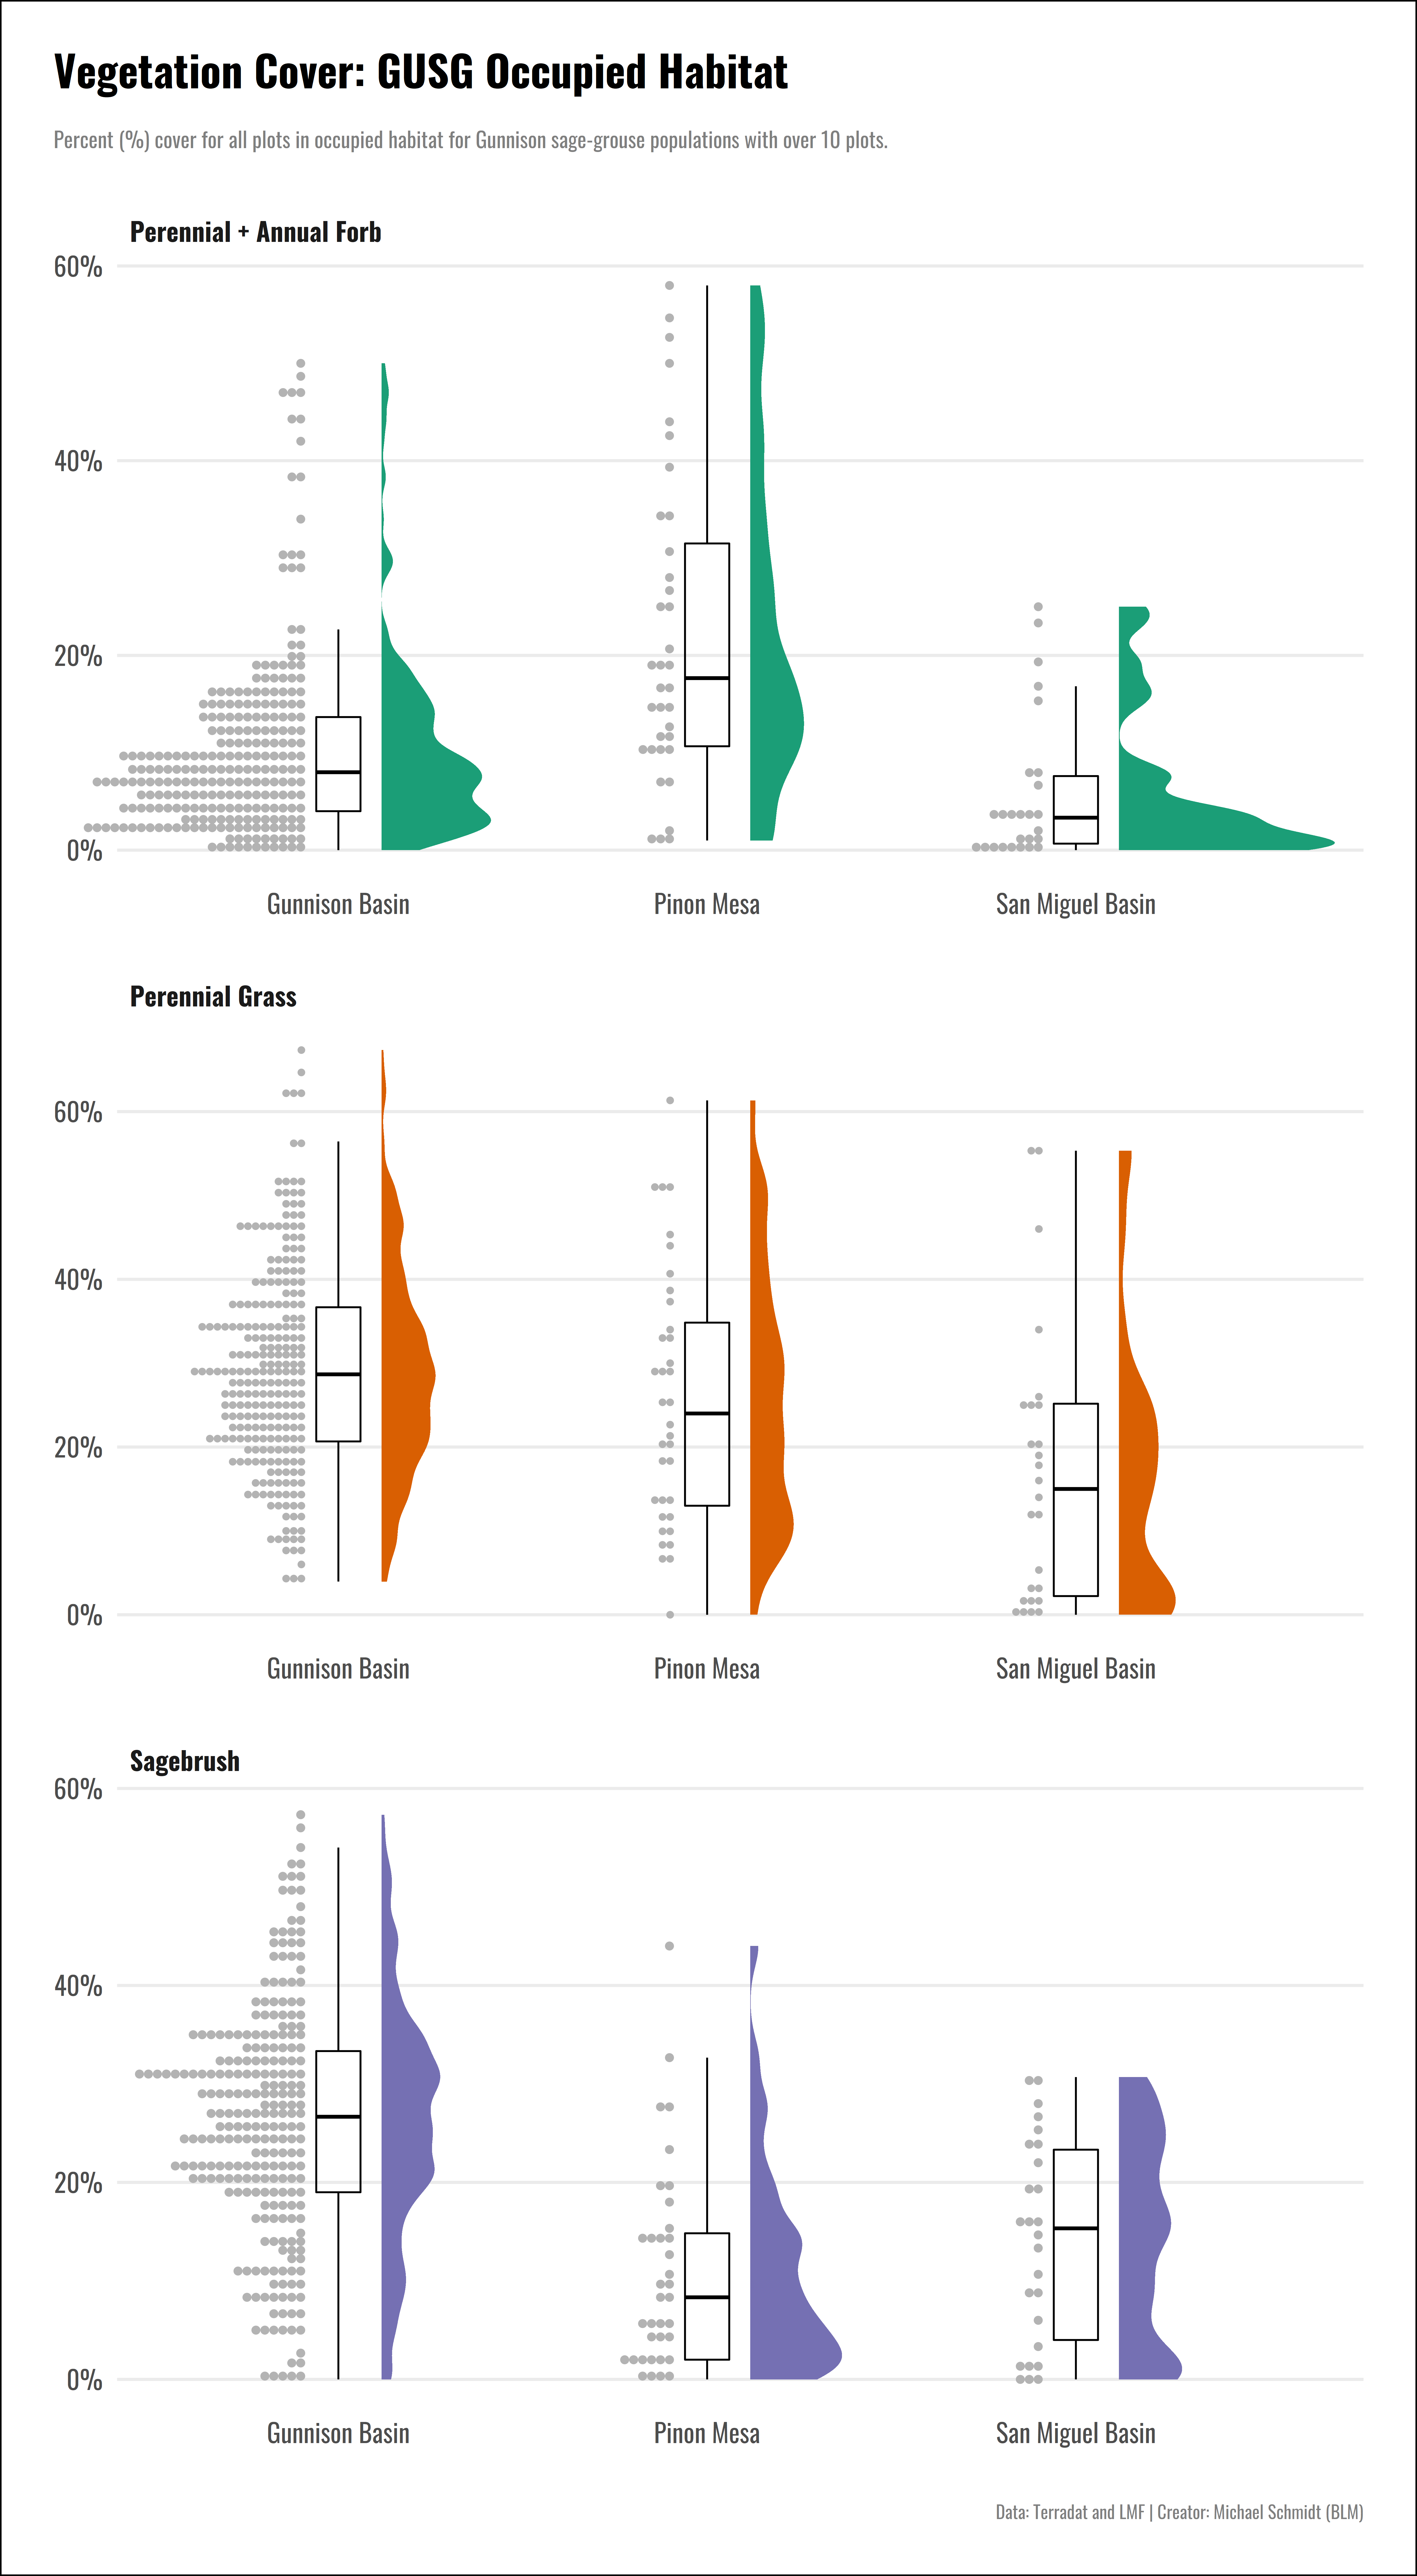
Gunnison sage-grouse Habitat Comparison
Similar to my post last week, we are again looking at another AIM data visualization. The last visualization was created from the raw AIM data, pulled from ArcGIS online. This visualization is pulled from terradat, AIMs online data repository for QA/QCed data, and looks at cover over three populations of Gunnison sage-grouse in Colorado, the San Miguel population, the Gunnison population and the Pinon Mesa population.

And the Scripts
Setup and cleaning scripts:
library(sf)
library(AimSqlTools)
#or
# devtools::load_all()
library(raster)
library(tidyverse)
library(unitnames)
library(janitor)
library(ggdist)
library(extrafont)
sf_use_s2(FALSE)

loadfonts(device="win")
theme_set(theme_minimal(
  base_size = 18,
  base_family = "Lato"
))

theme_update(
  panel.grid.minor = element_blank(),
  panel.grid.major.x=element_blank(),
  plot.background = element_rect(fill="white"),
  plot.title=element_text(size=24, family="Lato Black"),
  plot.subtitle = element_text(size=12, color="grey50", margin = margin(10, 0, 30, 0, "pt")),
  plot.title.position = "plot",
  plot.caption = element_text(size=10, color="grey50"),
  plot.margin = margin(30, 30, 30, 30, "pt")
)

proj<-4617

data<-load_terradat(connection="AIMPub")

ch<-read_sf("test/test_data/FCH_Centrocercus_minimus_20141120.shp")%>%
  st_transform(crs=4617)

gusg_aim<-data$tdat%>%
  st_transform(proj)%>%
  sf::st_crop(ch)%>%
  sf::st_join(ch)%>%
  janitor::clean_names()

gusg_lmf<-data$lmf%>%
  st_crop(ch)%>%
  st_join(ch)%>%
  janitor::clean_names()

  lmf_aim_gusg<-gusg_aim%>%
  as_tibble()%>%
  dplyr::select(unitname, ah_sagebrush_cover, ah_non_nox_peren_forb_cover:ah_non_nox_ann_grass_cover, OCCUPANCY)%>%
  bind_rows(
    gusg_lmf%>%
      as_tibble()%>%
      dplyr::select(unitname, ah_sagebrush_cover, ah_non_nox_peren_forb_cover:ah_non_nox_ann_grass_cover, OCCUPANCY)
  )

lmf_aim_gusg_2<-lmf_aim_gusg%>%
  as_tibble()%>%
  mutate(ah_grass_cover_new = ah_non_nox_peren_grass_cover/100,
         ah_forb_cover_new = (ah_non_nox_ann_forb_cover+ah_non_nox_peren_forb_cover)/100,
         ah_sagebrush_cover_new = ah_sagebrush_cover/100,
  )%>%
  dplyr::select(unitname, OCCUPANCY:ah_sagebrush_cover_new)
The plot scripts:
lmf_aim_gusg_2%>%
  filter(!is.na(OCCUPANCY),
         OCCUPANCY=="OCCUPIED",
         unitname!="Monticello-Dove Creek",
         unitname !="Crawford"
  )%>%
  pivot_longer(ah_grass_cover_new:ah_sagebrush_cover_new, names_to = "category", values_to = "cover")%>%
  mutate(
    category = case_when(
      category=="ah_grass_cover_new"~"Perennial Grass",
      category=="ah_forb_cover_new" ~"Perennial + Annual Forb",
      category=="ah_sagebrush_cover_new"~"Sagebrush"
    )
  )%>%
  ggplot(aes(unitname, cover, fill=category, color=category))+
  facet_wrap(~category, ncol=1, scales="free")+
  scale_fill_brewer(palette = "Dark2")+
  stat_halfeye(
    adjust = 0.5,
    width = 0.65,
    justification = -0.2,
    .width = 0,
    point_colour = NA
  )+
  geom_boxplot(
    width=.12,
    outlier.color=NA,
    fill=NA,
    color="black"
  )+
  stat_dots(
    side="left",
    justification = 1.1,
    binwidth=0.0085,
    color="gray70",
    fill="gray70"
  )+
  coord_cartesian(xlim=c(1, NA), clip = "off")+
  scale_y_continuous(labels = scales::percent_format(accuracy = 1))+
  labs(
    title="Vegetation Cover: GUSG Occupied Habitat",
    subtitle = "Percent (%) cover for all plots in occupied habitat for Gunnison sage-grouse populations with over 10 plots.",
    y="",
    x="",
    caption = "Data: AIM and LMF | Creator: Michael Schmidt (BLM)"
  )+
  theme(
    legend.position = "none",
    strip.text = element_text(family="Oswald Bold", angle = 0, hjust = 0),
    panel.spacing = unit(2, "lines"),
  axis.title.y=element_blank()
  )