Random Forest Resources and Notes
Resources to understand and run random forests in r.
What is Random Forests?
Random forests is a supervised machine learning algorithm. It uses an ensemble of decision trees to predict classes or run a regression. Here we will explore classification only because it is easier to understand. Let's unpack this:
Decision Trees
Decision trees are a method to make predictions. The easiest way to understand how they work is to look at an example. A commonly used example is trying to predict which passengers on the Titanic survived the disaster. At the very root, this is a classification problem. Using information about the passengers -- age, sex, ticket price, sir name, section of the ship, etc.-- we want to be able to predict which passengers will survive and which passengers will not.
Before we understand how decision trees work, its important to understand how building a model, like random forests or others, works. To set up a supervised learning problem, you have to have three things.
- A dataset that has many observations (in the titanic example, each observation is an individual on the ship)
- Each observation needs to have many predictive variables of information for (such as sex, age, etc.).
- We must know the outcome for each observation. In the titanic example, we know who survived the disaster and who didn't. Thirty eight (38%) of the titanic passengers survived.
The goal is to use the observation variables to predict who survives. So how is this done with decision trees?
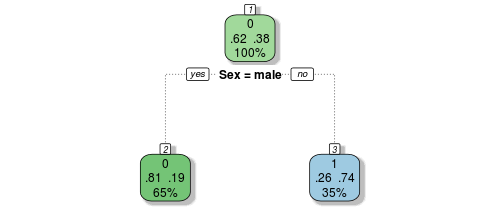
Trees are made by splitting (branches) variables. In the case of the titanic survivors, let's look at how a tree could be used to predict who survives:

Let's make the first branch on our tree by splitting the observations based on sex by asking "is sex male?". Only 0.19 (19%) of the males survived. Classification work based on a 0.50 cutoff. Because only 0.19 survived this bucket, or bag, is counted as perished. So the model says, all males died. Now lets look at the other side of the tree, the female branch (or node). On this side of the branch, .74 or 74% survived. Unlike the male node, because this is over 0.50, the bag is counted as survived. If we stopped here we would have a model that predicts that all males died and all females survived. It would be incorrect 26% of the time for females and 19% for males. To improve the model we can use more variables to further parse our data and improve our prediction.

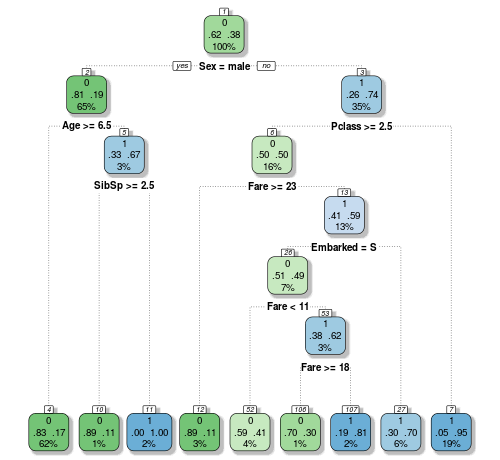
Now that we understand the splits you can follow the the graphic above through its logic all the way to its conclusion. The variables used are sex, age, SibSP (the number of siblings or spouses each passenger had), fare, Embarked, and Pclass (passenger class). But this is a relatively short tree. We could continue to split nodes as many times as they could be split. This might seem like a good idea, but it leads very often to over fitting. Meaning that, while the splits (model) fit the data you are training it with, it will perform poorly when applying that model to data you want to predict. To solve this problem, we can use an ensamble of many trees.
What is an Ensamble?
Definition: A unit or group of complementary parts that contribute to a single effect
There are many problems with decision trees. One of which is overfitting, mentioned above, but the other is that once they make a split based on a variable, they have no way of going back to that split to make sure the split was made at the correct spot in the correct location of the tree.
Random forests uses many trees to with a variety many schemes of splits with varying levels to get around both of these problems. To perform these various splits it bags the observations. Bagging is taking a sample of the observations and building a tree off of the sample. This is done because if all of the data was used for each tree, there would be very little variation on how the data is split. But by growing a tree from a subsample of the total dataset, trees will be different because they are based on different and random set of observations.
The ensemble approach comes from taking the most votes from the sum of the trees. In the titanic example, lets take one passenger from the titanic. Lets say 5 trees are grown using random forests. Two of the trees predict that the passenger will die and three of the trees predict that the passenger will live. The final prediction from this ensamble would be that the passenger would live because greater than 50% of the time that passenger was voted to have lived.
Runing Random Forsts in R
Coming Soon!
Resources
- Class imbalance
- Two methods for handling class imbalances. 1) under-sampling - only using a subset of the class with more observations. 2) oversampling - randomly duplicate the class with fewer observations.
- Uses caret package to perform cross validation.
- On why class balancing is a problem: "assume we had 10 malignant vs 90 benign samples. A machine learning model that has been trained and tested on such a dataset could now predict “benign” for all samples and still gain a very high accuracy. An unbalanced dataset will bias the prediction model towards the more common class!"
- Explaining Black-Box Machine Learning Models - Code Part 1: tabular data + caret + iml, Explaining Black-Box Machine Learning Models - Code Part 2: Text classification with LIME & Explaining Keras image classification models with lime
- Titanic: Getting Started With R The best Random Forest explainer I've seen to date.